The Distance Premium: A Fortnight of Power Quality at a Rural Supply Extremity
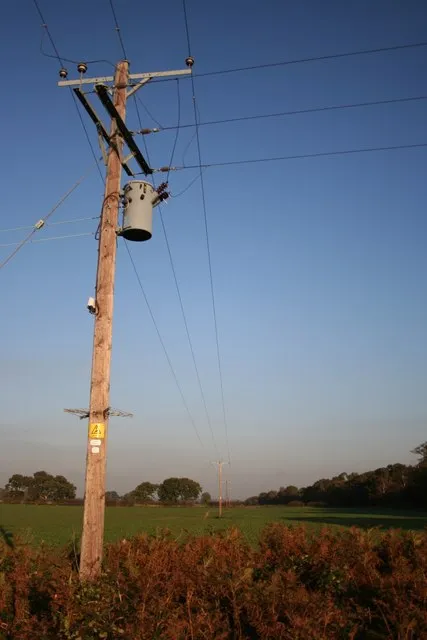
Photo: Richard Croft, CC BY-SA 2.0, via Wikimedia Commons
Rural supply extremities have never been electrically generous. Post-war electrification reached many British farms through long low-voltage spurs and shared transformers, and the resulting impedance was tolerable when the load was lighting, a few motors and perhaps an electric cooker. The load mix has since changed. Heat pumps, EV chargers, grain and feed equipment, and rooftop PV all impose their own patterns on a line that was not designed around them.
To see what that looks like in practice, CavLab installed a calibrated Class A power-quality analyser at a farmstead in upland Cumbria for 14 days in October 2026. The site sits near the end of an 11 kV feeder and a long low-voltage spur, with a shared transformer serving the farmhouse, an agricultural building and two neighbouring properties. The logger recorded 10-minute RMS phase voltages, fundamental negative-sequence unbalance, short-term flicker (Pst), long-term flicker (Plt) and phase currents. Separate logging captured the heat pump, a 7.4 kW EV charger, a workshop compressor and a 4 kWp PV inverter.
Voltage: the mean hides the events
Across the fortnight, the mean phase voltage was 237.4 V. That figure is unremarkable and sits comfortably inside the statutory envelope. The distribution of 10-minute means is more useful. Values ranged from 213.8 V to 250.6 V. The lower bound of the Electricity Safety, Quality and Continuity Regulations — 216.2 V for a nominal 230 V supply — was crossed in three 10-minute intervals, all between 17:40 and 19:20, when the air-source heat pump, the EV charger and the workshop compressor overlapped. That is 0.3% of the logged intervals, but it is not zero.
The upper bound of 253 V was not crossed. The highest readings came during bright, low-load periods when the PV inverter was exporting and the farmhouse load was light. The margin was thinner than the mean suggests: 250.6 V leaves only 2.4 V of headroom before the statutory ceiling.
The distinction between statutory limits and the statistical limits in BS EN 50160 matters here. The ESQCR sets absolute bounds for supply voltage, subject to specified exceptions. EN 50160 describes the voltage characteristics a distribution network operator should deliver for 95% of the time. On this site, the EN 50160 95% criterion would still pass because almost all intervals remained within the wider ±10% band. The ESQCR lower bound was nevertheless breached. A single compliance statement can therefore conceal a real operational event.
Unbalance: the single-phase penalty
Negative-sequence unbalance stayed below 1% for most of the fortnight. The maximum 10-minute value was 2.7%, recorded when the EV charger was drawing single-phase on L2 while the workshop compressor and the farmhouse load were running on other phases. EN 50160's 95% limit of 2% was not breached across the fortnight as a whole, because only 0.9% of intervals exceeded it.
Short episodes still matter. An induction motor supplied with unbalanced voltages experiences negative-sequence current that produces a reverse rotating field. The effect is heating rather than useful torque. A 2.7% unbalance is not catastrophic, but it adds losses and temperature rise to pump and fan motors that may already be running near their rating. The same unbalance can disturb the phase-locked loops in grid-tied inverters, although the PV inverter at this site logged no grid trips during the fortnight.
Flicker: what the lamp sees
Flicker was the most variable parameter. Pst exceeded 1.0 on 1.6% of 10-minute intervals, with a maximum of 1.42. Plt exceeded 0.8 in two 2-hour windows, reaching 0.86. The largest Pst values coincided with compressor starts and the heat pump's defrost cycle, both of which produce step changes in current at the end of a line with limited fault level.
Flicker is not the same as visible annoyance. A Pst of 1.42 is above the EN 50160 planning level, but whether occupants notice it depends on the lamp, the wiring and the time of day. Filament lamps are more forgiving of slow voltage changes than some LED drivers, and the reverse can also be true. The logger measures the modulation; it does not measure irritation.
What it means for inverters and appliances
Modern appliances are often described as tolerant of voltage variation, and broadly they are. Switched-mode power supplies and inverter-driven compressors accept a wide input range. The more relevant effects at this site were secondary. A resistive heater delivers less heat at 214 V than at 230 V. A fixed-speed motor draws more current for the same shaft output when voltage falls, which raises winding temperature. Repeated step changes exercise control loops and contactors. None of these is a single-cause failure mode, but together they represent a distance premium that is paid in efficiency, thermal margin and component life.
The PV inverter behaved correctly throughout, but its voltage headroom is worth noting. On a weak spur, local generation raises terminal voltage before the energy has travelled far. If the property added a second array or a larger EV charger without network reinforcement, the interplay between export and import would become tighter.
The standards, and what they do not settle
BS 7671's voltage-drop guidance for installations is a design tool, not a statement about supply quality. The ESQCR sets the statutory envelope. EN 50160 describes the statistical characteristics of the supply. None of these fully describes what a rural customer experiences when a heat pump, an EV and a workshop load coincide at the end of a long spur. The standards are necessary, but they are not a substitute for time-series measurement.
This was one site, in one season, with a particular mix of loads. It is not a verdict on rural networks. It is a reminder that end-of-line voltage is not a single number. It is a distribution, and the tails of that distribution are where appliance behaviour, inverter settings and network planning meet.