The Metronome Under the Floorboards: A Year of Listening to the Mains
The mains is the least glamorous signal in a British home. It arrives at 230 V, nominally at 50 Hz, and is expected to do its job without commentary. Yet the frequency of that supply is a live measurement of the entire synchronous grid: every generator, every inverter, every demand response and every control-room action leaves a trace in the spacing between cycles.
For twelve months, CavLab kept a calibrated frequency logger connected to a domestic ring main in suburban Manchester. The aim was not to test the grid in the abstract, but to listen to it at the point where engineering becomes ordinary: the socket behind the sofa.
A Logger for the Least Glamorous Quantity
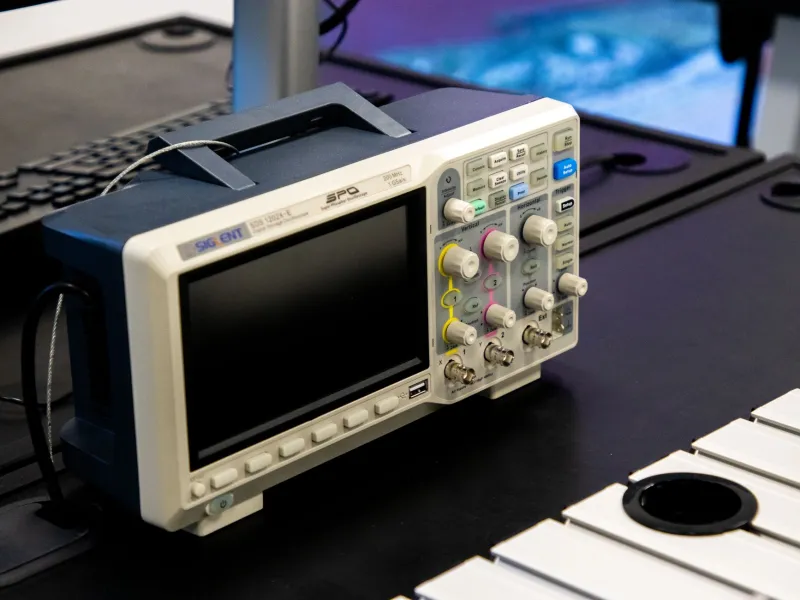
The instrument was deliberately simple. A small isolating transformer fed a zero-crossing comparator, and a microcontroller counted cycles against a temperature-compensated oscillator disciplined by GPS. Every second, the logger stored a frequency value, an RMS voltage reading and a timestamp. The design avoids the temptation to infer frequency from a software phase-locked loop inside a cheap meter; it counts actual mains cycles and compares them with a trusted timebase.
Bench calibration against a signal generator put the one-second frequency accuracy at better than ±1 mHz across the 49.5–50.5 Hz range. That is finer than the grid's normal operating band by a wide margin, although the measurement still inherits the limits of a single domestic installation. Voltage distortion, local loads and the wiring of the house do not change the frequency itself, but they can complicate zero-crossing detection. The comparator and input filter were chosen to keep that risk low.
The measurement period ran from November 2025 to October 2026. The logger was powered continuously, apart from two short interruptions for calibration checks. It recorded roughly 31.5 million one-second samples.
What Twelve Months Look Like
At the coarsest level, the result is reassuringly dull. The annual mean was 50.000 Hz to three decimal places. For 99.7% of recorded minutes, the one-minute average sat between 49.95 and 50.05 Hz. Most of the time the deviation from nominal was smaller than the resolution of a domestic energy monitor.
The interesting behaviour sits in the tails. The widest low-frequency excursion in the record was 49.76 Hz for just under nine seconds during a January transmission disturbance. The highest reading was 50.14 Hz, brief and associated with a sudden loss of demand rather than generation. Neither event would have been noticed by most household equipment. Both were visible as clear, sharp-edged deviations in the logger's second-by-second trace.
A daily pattern emerged, but not the one often assumed. Frequency was not simply 'low at teatime'. The evening demand ramp produced a wider spread of readings, with more small corrections in both directions as the system operator balanced generation against changing demand. Overnight, when demand is lower and the generation mix is often more inverter-dominated, the frequency was not necessarily less stable; it was differently stable. Deviations were smaller in amplitude but sometimes faster to develop, reflecting a system with less physical inertia and more active control.
Seasonality mattered too. The winter months produced the largest single excursions, largely because the largest losses of infeed and the largest demand ramps tend to occur when the system is already stressed. Summer produced fewer dramatic events but a more persistent low-amplitude wander, particularly on windy nights when synchronous generation was low and control action was doing more of the work.
The Physics Behind the Wobble
Mains frequency is a shared speed. When generation exceeds demand, the synchronous machines that remain connected speed up; when demand exceeds generation, they slow down. In a system with large coal, gas and nuclear plants, rotating mass provides inertia: a physical resistance to sudden change. That inertia buys the control room time to arrest a fall or rise in frequency before it becomes a problem.
As the UK's generation mix has changed, the source of that resistance has changed with it. Wind and solar farms connect through power electronic inverters, which do not inherently provide rotating inertia. Battery storage can respond very quickly, and synchronous condensers can provide inertia without generating bulk energy, but neither is free. The system operator now manages frequency with a portfolio of response services, inertia procurement and operational constraints. The quiet wobbles in a domestic socket are partly the sound of that management working.
This is why a year of measurement is more useful than a single dramatic event. The grid is not a metronome driven by an unvarying force. It is a controlled machine, and its frequency is the error signal in a very large feedback loop. Small deviations are not evidence of failure; they are evidence of control. The relevant questions are how quickly deviations are arrested, how much margin remains and whether the control services are sized for the events that actually occur.
What It Means at the Socket
For most appliances, almost nothing. A resistive heater ignores frequency. A switch-mode power supply rectifies the mains and regulates its own output, so a 0.1 Hz deviation is irrelevant. A fridge compressor motor will run imperceptibly faster or slower, but the change is a fraction of a percent. Modern solar inverters and battery systems are designed to ride through normal frequency variations and to disconnect only within specified limits.
The exceptions are narrow but real. Mains-powered clocks that count cycles will accumulate a few seconds of error over a year if the grid spends long enough away from nominal; in practice, the grid's long-term average is tightly corrected. Some older synchronous motor-driven devices can drift in speed. Uninterruptible power supplies and generators may transfer or synchronise differently depending on their settings. None of this amounts to a household hazard under normal operation. The serious risks begin when frequency leaves the normal band for long enough to trigger load shedding or generator protection, and those are system events, not socket-level annoyances.
It is also worth remembering that frequency is a system-wide quantity. A logger in Manchester is, in effect, listening to the same synchronous area as a logger in Cornwall or Glasgow. That makes the measurement powerful and limited: it captures the collective behaviour of the grid, but it cannot tell you which generator moved first or which control room instruction followed.
Where the Headlines Overshoot
The language around grid stability often swings between complacency and alarm. A year of data supports neither. The UK grid is not drifting casually away from 50 Hz; it is held within a narrow band by active control. But the physics of that control have changed. Lower inertia means disturbances propagate faster. More inverter-based generation means the system operator must procure services that once came for free from spinning metal. The margins are narrower than they were, even if the day-to-day signal looks calm.
The logger will stay connected. A second year will allow a like-for-like comparison, and a third will start to separate seasonal noise from structural change. For now, the conclusion is modest and technical: the mains is a metronome, but not a rigid one. Its small deviations are the audible signature of a grid being balanced in real time, and that is a more interesting story than either panic or indifference.