Where the Watts Sleep: Seven Days of Standby Measurement in a British Home
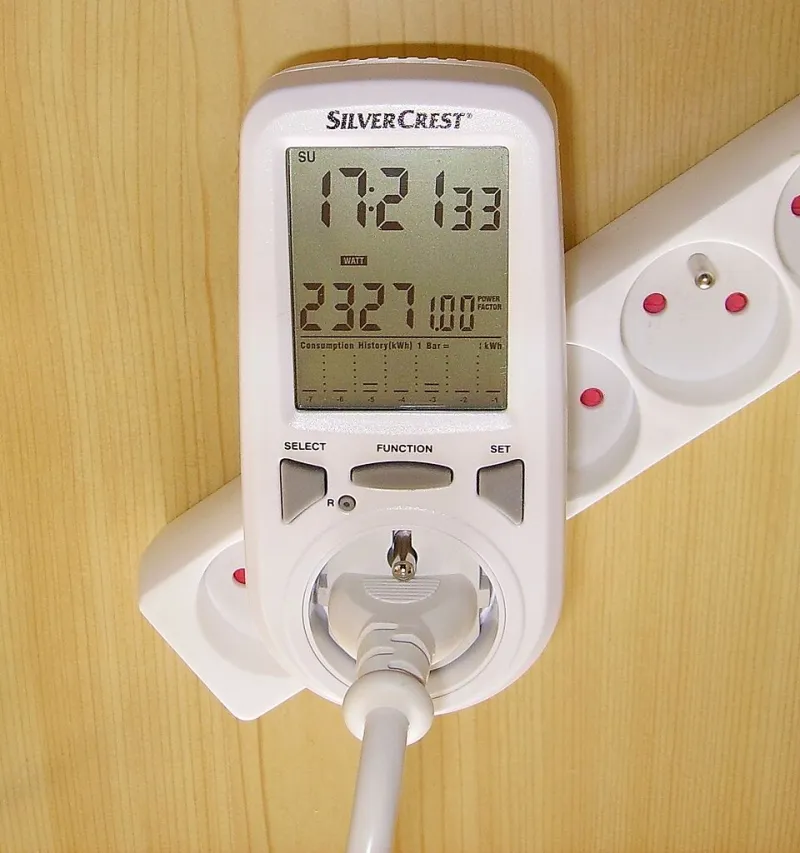
Photo: Cjp24, CC BY-SA 3.0, via Wikimedia Commons
A standby audit sounds trivial until you try to attribute a single watt. The UK's smart meter network reports at half-hourly granularity, which is fine for spotting an oven but useless for a 1.8 W microwave clock. To get underneath that resolution, CavLab spent a week in a three-bedroom Victorian semi in Sheffield, instrumenting every socket that stays powered when the house is quiet.
Method: plug meters, a logger and normal life
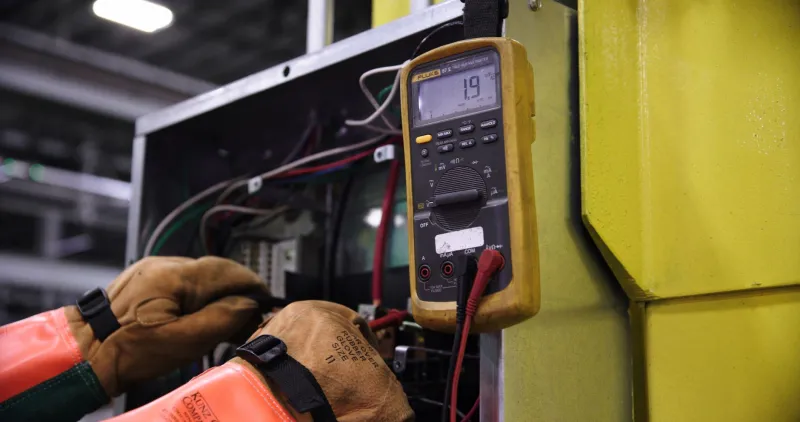
The house was occupied throughout by two adults working from home, which is the awkward case: much of the standby load is also the working-day load. Measurement used eight plug-in energy monitors with 0.1 W resolution and a stated accuracy of ±2% plus two counts, rotated across sockets on a fixed schedule, alongside a four-channel logger sampling whole-house current at one-minute intervals via a split-core current transformer on the incoming tails. Each device was measured for at least 48 hours, and always-on loads were separated from duty-cycled ones by inspecting the minute-by-minute trace. The logger's own contribution, 2.1 W, was subtracted.
The always-on spine
Broadband is the largest single block and the one least amenable to switching off. The router drew 9.8 W, the fibre termination unit 4.6 W and two mesh nodes 4.1 W and 3.8 W, giving 22.3 W continuous. Over a year that is roughly 195 kWh; at 31p per kWh it costs about £60 to keep the house connected, before anyone streams anything. Manufacturer figures for the router quoted 12 W maximum, which the measurement supports once the external power supply's losses are included.
Living room
The television's standby figure was 0.4 W, which looks exemplary until the quick-start setting is enabled: the same set then draws 13.6 W so that it can wake in under a second. The soundbar added 0.6 W, a streaming stick 1.2 W and a games console in instant-on mode 11.4 W, most of which is the always-listening wake circuit. An older set-top box held 7.8 W. The living room's floor was therefore 4.6 W in eco configuration and 34 W in convenience configuration — the same hardware, two very different houses.
Kitchen and boiler cupboard
Boiler controls are the sleeper. The combi's integral control board drew 2.1 W, a wireless thermostat receiver 1.5 W and a smart radiator valve hub 2.4 W. The microwave clock took 1.8 W and a coffee machine's touch panel 0.9 W. None of these can sensibly be unplugged; the point is that they form a permanent, non-negotiable load. The fridge's compressor cycling dominated the kitchen trace and was excluded from the standby total, since refrigeration is a service rather than a leak.
Hallway and front door
A video doorbell averaged 2.6 W across the week, with peaks near 6 W when it uploaded clips. Its indoor chime held 0.8 W. The intruder alarm panel drew 6.2 W, most of it float charging a lead-acid battery that is now five years old. And the adapter graveyard — three USB chargers and a disused router supply still in a trailing socket behind the coat rack — contributed 1.4 W between them. Individually trivial; collectively the equivalent of leaving a light on all year.
Bedrooms and study
Phone chargers with no phone attached measured between 0.05 W and 0.3 W, close to the resolution floor and not worth chasing. Laptop bricks were worse, at 0.2 to 0.5 W, and a monitor in deep standby 0.3 W. The study's printer was the surprise at 1.9 W, held awake by wake-on-LAN. A USB-C dock drew 4.2 W with nothing connected to it, because it was powering its own Ethernet and display outputs.
The floor, summed
Adding the measured always-on loads gives 96 W average across the week, or 841 kWh a year — about £260 at current UK rates. Strip out the router, termination unit, mesh nodes and boiler controls and the figure falls to 62 W. The whole-house logger agreed within 4 W once the fridge, heating pump and occasional appliances were accounted for, which is a reasonable cross-check for a method built on plug meters.
What smart-home assumptions get wrong
Smart control does not remove standby; it relocates it. Each smart plug used in the audit consumed 0.6 to 1.1 W, a hub 2.4 W and a smart speaker 1.8 W in idle. Fitting ten smart plugs to tame ten forgotten adapters would add more load than it removed. The technique works only where the controlled device's standby is large relative to the plug's own draw — games consoles and set-top boxes qualify; phone chargers do not.
Practical conclusions
Measurement first, switching second. Group the genuinely switchable loads — console, set-top box, soundbar, printer, dock — onto one switched extension per room and accept the wiring inconvenience. Turn off quick start on the television and instant-on on the console; both are settings, not purchases. Leave the router, termination unit, alarm and boiler controls alone: they are doing work. And treat manufacturer standby figures as best-case laboratory values, because the difference between 0.4 W and 13.6 W is usually a menu option rather than a component.