Ten Seconds Behind: What Three Smart Meter Displays Leave Out of the Numbers
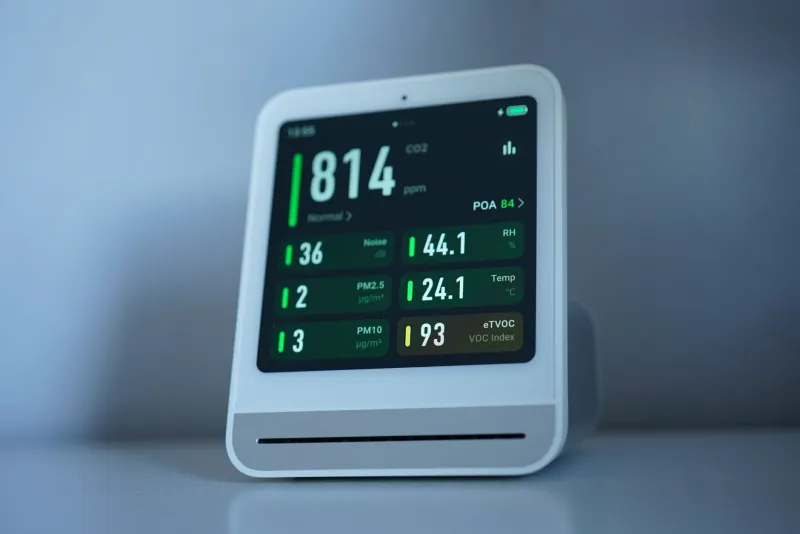
The in-home display is the only part of a smart metering installation that most people ever touch. The meter sits in a cupboard, the communications hub blinks unread beside it, and the pair of them get on with the business of metrology and settlement. What reaches the kitchen worktop is a small screen showing a number in kilowatts and a number in pounds, and for a great many households that screen is the entirety of their energy feedback. It is worth asking, then, how closely it tracks reality.
The short answer is that the IHD is not a measuring instrument, and judging it as one is a category error. It is a rendering device at the end of a chain that begins with a current shunt and ends with a firmware routine that decides how many decimal places to print. The interesting question is not whether it agrees with the meter to three significant figures. It is what the display does to the number on the way through, and what a household is entitled to conclude from it.
The chain, end to end
British SMETS2 electricity meters are approved to the relevant MID class for active energy, which in practice means a few tenths of a percent of error at reference conditions across the rated current range. That is a mature, well-audited piece of engineering. Everything downstream of it is not.
Between the meter register and the digits on the screen sit the communications hub, the Zigbee home area network, the display's own processor and firmware, its rounding rules, and a tariff table that has been written into the device rather than measured by it. Each stage adds something. Only the first stage is a metrological question at all; the rest are matters of timing, presentation and configuration, and it is there that the discrepancies we recorded almost entirely lived.
How we tested
We spent eight weeks in a three-bedroom semi-detached house in the Midlands with a 4.1 kWp roof array and a downstream diverter, which gave us a reasonably varied diet of import, export and near-zero overnight periods.
The reference was a calibrated logger with a stated accuracy of ±0.5% of reading, using a split-core CT on the incoming tails and a pulse input from the meter's own LED, timestamped every second and aggregated to the minute. Against that we ran three displays, labelled A, B and C: a supplier-issued unit, a second supplier-issued unit of a different generation, and an aftermarket display fed from a consumer access device. Screens were captured by a fixed camera at ten-second intervals, with manual transcriptions at the start and end of every load event to catch anything the camera framing missed.
This is not a type test and not an accreditation exercise. Three units in one house over one autumn is an anecdote with a spreadsheet attached. It is, however, a more careful anecdote than most households will ever have the chance to assemble.
Cadence is not the same as measurement
The first thing to understand about the display is that its refresh rate is a push rate, not a sampling rate. Electricity data arrives at roughly ten-second intervals on most installations. That ten-second figure gets quoted as though it were the resolution of the system. It is not. At a sustained 100 W — a router, a standby-laden television, a fridge in its quiet phase — a register displayed to the nearest 0.01 kWh takes six minutes to move by a single digit. A household watching the screen during a low-load evening is watching a number that is technically correct and practically frozen.
That has consequences for the instantaneous power figure too. A short burst from a kettle appears, disappears and is sometimes missed altogether by a viewer glancing at the screen, because the ten-second window happened to straddle it. Unit A was the most responsive here; Unit C was consistently one cycle behind and occasionally two.
Where the numbers actually diverge
Over the full fifty-six days, the cumulative import registers on the three displays ended within −0.4%, +0.2% and −1.8% of the reference respectively. Those are respectable figures for a rendering device, and they flatter it. The daily picture was more interesting: the largest single-day discrepancies had nothing to do with gain error. They came from timing. A firmware clock offset on Unit C meant its midnight boundary landed about four minutes late, which moved a 3 kW evening load into the following day for accounting purposes. On a time-of-use tariff, that is not a rounding curiosity; it is a band boundary, and a band boundary in the wrong place is a price change.
Cost figures deserve separate scepticism. The display does not measure pounds. It multiplies registers by a tariff table, applies a standing charge on its own schedule, and rounds to the penny. The arithmetic is usually right and the inputs are usually right, but neither is verifiable from the screen, and a household reconciling a bill against an IHD is comparing two different documents.
Export, and the awkward sign
The displays handled export less elegantly than import. Two of the three showed a separate export register, correctly labelled. The third used a single signed figure that flipped between positive and negative depending on which register was dominant, without an unambiguous indicator of which was which. The underlying register was accurate. The presentation invited misreading, and on a bright October afternoon with the diverter saturated, that misreading is exactly the sort a homeowner might carry to a supplier.
Dropouts and silence
Each unit lost its HAN connection at least twice. In every case it recovered without intervention, and in every case it continued to display the last received value while doing so. One unit did this for forty minutes with no visual indication that the number had stopped moving. That is the failure mode worth worrying about, because it is invisible. A meter that fails is a fault; a display that quietly freezes is a plausible-looking number that no longer means anything.
Why the last metre matters
Market-wide half-hourly settlement, time-of-use tariffs and the general policy hope that consumers will shift load all rest on feedback. The IHD is the cheapest, most universal feedback channel the programme has. If it is understood as a nudge device, it performs adequately. If it is understood, as many households understand it, as a window onto the bill, then its ten-second latency, its coarse rounding and its silent freeze-ups are not cosmetic.
The realistic ask is modest: an explicit timestamp on screen, an honest indicator when data is stale, consistent labelling of export, and published rounding rules. None of these is expensive. All of them would make the last metre of the chain as trustworthy as the first.